Looking back to my previous post,
As I said The first UPSIDE part hasnt finished and it should finish around 1.37500
Now, to Make it possible eur/usd should see most amazing throw-over soon.
Believe or not A sound break above 1.32250 is SIGNAL FOR STRONG, Bling Buy...
Target for this buy isn't 1.37500 directly but around 1.35-1.36
That will finish 5 wave sequence, then a smaller retracement and then final Up for 1.37500
Ray
We all have dreams. But in order 2 make dreams into reality, it takes an awful lot of determination, dedication, & discipline. -Jesse Owens
Monday, December 31, 2012
Saturday, December 15, 2012
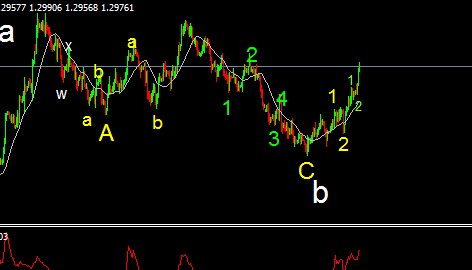
Weekly eur/usd Channels update : Triangle

To fix the Triangle's wave E (from 1.2400), there has to be unique 2 separation of the leg E
The first one has not finished, the yellow cross mark suggest first major break of the rise since 1.2440(the begining of E), 1.37400
Then eur should reverse back in very impulsive manner to 1.33900 - 1.31500 /
From there is C wave begining of very sharp diagonal making last wave of triangle.
TARGET NO More than 1.46500.
In order to excel, you must be completely dedicated. - Willie Mays
Ray.
Thursday, December 13, 2012
Elliott Waves Counting Update 4H
Below 4h elliott wave counting,

The most clear picture will be eur/usd is in the Last wave,5th wave finishing 3rd wave(green)
But the ECB press conference made eur to fall in ABC sequence or is it 5 wave..
Green 1 - ab
Green 2 - ab
Blue 1 - minor A n B
Blue 2 - similar ECB press conference fall
Blue 3 - Striking thrust A n B ( also comparable to blue 1 - very identical )
Blue 4 - Most probably ended at trend line touch
Are we in Blue 5? or we are seeing blue 4 as flat?
Yet to be known..
RAY
Wednesday, December 12, 2012
Instead wave B Probability
The fall was shallow,
if it wasn't 1 to 5, was it failed? or is it ABC.. I will update it..

if it wasn't 1 to 5, was it failed? or is it ABC.. I will update it..
Target could be bit above of recent high 1.31200 or just below 1.31100
Friday, December 7, 2012
The Ecb Press conference after a failed diagonal and illusionary! diagonal as 1st wave

The most interesting thing was The irregulat wave 2
Its still should be look forward for wave pattern(above pic)
As pic shows, its impulsive diagonal !
if it is then the 5th wave of its should be equal of third wave OR a failed?
However, another wave pattern should be in concern for above pic
Monday, November 26, 2012
The last flight to 1.30600 before first fall of a great rise!

As above pic, wave C might be of An Impulse
Right now, I am predicting a rise leading to 1.30500/600 area making it last or 5th wave of a diagonal wedge making it 1st complete wave in a nested impulse.
Eur/usd aims 1.30600 at least before I can see a major fall but not much
Lets see.
Ray
Saturday, November 24, 2012
Wave C Construction

Elliott wave counting of the recent trend change
A break of 1.300 is necessary to correct above pic.
On the opposite, if I can see eur falling from 1.30 around area, there is chance of 'expanding type' diagonal as first wave, making 1.300 area as 3rd wave of expanding type.
The Euro group meeting is still on today, Saturday and it will be held on Monday too.
This certain rising has been observed in the mentality of 'euro group meetings'
RAY.
The game is my wife. It demands loyalty & responsibility, & it gives me back fulfillment & peace. -Michael Jordan
Friday, November 23, 2012
FINALLY THE Fire Works Begins
AND FINALLY THE FIRE WORK Begins
The classical wave C will be an Impulse or a Wedge?
Lets see people !
RAY
Sunday, November 18, 2012
The Blue Print of Flat Pattern, Wave B

white wave a was 55 days long,
white wave b is 57 days long,
Here, white wave b hasnt retraced 50 percent of a
This flat pattern (above pic ) is similar to wave B found at the start of this UP-Trend
It is the same point where the hurricane called expanding diagonal developed, This time it could be more damaging.
Ray
Thursday, November 15, 2012
A break up on 1.28800 needed!

Gold A
Gold B, the irregular Flat (Green a b c )
The question is Are we onto fireworks? A break above 1.28800, the break should be sharp and work done
Eur Goes up at least above 1.35000 probably more and more
This flat pattern suggest it was just a pause!
It will be interesting to see
Ray
Monday, November 12, 2012
The beginging at 1.26500

THE FIREWORKS around 1.26500
if breaks below it will indicate another count, but unlikely.
Tuesday, November 6, 2012
The Postponed Firework begins
Yes, This could be very assured probability of Eur firing Up-side.
The 'flat' correction as Major Wave B, ladies and gentlemen.
What interesting is :- Now IF wave C begins what kind pattern it will be?
Lets fix Major wave A, Major Wave B and up coming wave C
Major Wave A
Double zigzags + double irregulars + double zigzag = A
Double zigzag (Flat) = B
Expanding Diagonal = C
Major Wave B
Perfect Flat Pattern
---------Awaiting For Major wave C.
Friday, October 26, 2012
Fireworks ahead for Eur/usd

It was NOT Tri-angle as Wave B but its a Flat correction as wave B.
We are very near to end this Flat pattern
Above pic,
Yellow wave C's wave d is still missing, However if its a failed diagonal then a break above 1.30200 means its over & trend is now UP and changed.
The B wave\'s flat correction is less than 38.2% , this means Very strong up-side impulse or diagonal could be observed for eur/usd.
Fireworks ahead, ladies and gentlemen!
Ray
Tuesday, October 16, 2012
The pattern of triangle

Triangle means the previous trend is still working on..
Here, wave d isn't finished yet, it surely go a bit higher than 1.30605
More importantly, then after eur/usd should move back towards 1.2840 area.
The construction of triangle as below :
wave a = double three
wave b = a double zigzags ( where wave C was an impulse! )
wave c = wave a
wave d = wave b ..
wave e = wave a=wave c??
that will be seen
Thursday, October 11, 2012
The Triangle as Wave B
Picture showing ABCDE

Here, Skycolor a and c have the same wave pattern, abcA-B-C.

Here, Skycolor a and c have the same wave pattern, abcA-B-C.
Ascending-Descending Triangle as wave B
The wave B retracement isn't enough and has invalidated my prediction for 50% retracement.
I believed it should 50% retracement since previous major correction was Exactly 50% retracement, after the up-trend was started.
Surely this white wave B is triangle, but yet it hasn't retraced even 38.2%, as in book of Robert balan, a retracement that failed to go beyond 38.2% suggest a pent-up, underling strength! ( as previous post suggest any triangle leads destruction in other-side, according to time it has done it work in 50% of time retracement for wave B but not in retracement it self, however it was expanding diagonal according to my count )
Thus for me, it again comes to c=a or c=1.618.....
And the validity of my 'count'..
Bit exciting
These are substitutions of Elliott patterns
White wave A = a = double zigzag + double irregualrs + double zigzag
+ b = double zigzag
+ c = expanding diagonal
White wave B = triangle
White wave C = ( surely something but ''up'')
Wednesday, October 10, 2012
The reaction of expanding diagonal to otherside?
As previous post indicates, White c's wave c was a 'expanding diagonal'
If it is true then reaction in other trend could be very destructive.
I havent seen it in 4h chart, but looking closely in daily chart of eur/usd
it is seeking a sharp decline for 3rd wave of wave c.
One thing I should tell, Don't buy eur in this week!
If it is true then reaction in other trend could be very destructive.
I havent seen it in 4h chart, but looking closely in daily chart of eur/usd
it is seeking a sharp decline for 3rd wave of wave c.
One thing I should tell, Don't buy eur in this week!
Tuesday, October 9, 2012
Eur/usd going for wave B correction, Target 1.26133
Eur/Usd is having 'correction' as Wave B.
50 % retracement = 1.26133

Above pic, red line = 1.26133
50 % retracement = 1.26133

Above pic, red line = 1.26133
Saturday, October 6, 2012
Eur/usd aims 1.2730 are, Warning
As of previous post, Green A and now Green B has finished.
We should look for Down side right from Monday and acceleration from Tuesday
The target is 1.27300 area, 38.2% retracement from the high.
The wave B has been :-
Double zigzag + b + zigzag = green A
Green B = double zigzag + irregular + zigzag
Green C is now on, it should be impulse or diagonal type.
Tuesday, October 2, 2012
White wave B - 1

The blown-up up-side ABC has finished making white wave A.
We are not having white wave B.
Before of that,
White wave A = A ( double zigzags, irregulars & zigzags )
+ B ( double zigzags )
+ C ( expanding diagonal - the strong upside correction )
White wave B = (above pic) double zigzag (green a)
+ irregular(? green b)
Eur/usd daily

The difficult part (green abcde) is expanding diagonal as wave yellow wave c.
We have finished White A with yellow abc.
And we are looking for white wave B. I predicts white wave B could place around 1.263 area
Only a break above recent high 1.3170 could place invalidity for wave B...
White wave B's elliott count is in next post.
I am back !
It was out of sight and out of elliott predictions, I had to stop and get slow down on my counting to fix proper counting!
Finally I have come up with some probabilites, I will update it later.
But one thing was observed by me was ''shallowness of red candles''
From 1.22400 there are all strong green candles but before of that - all the falling red candles showing great shallowness..its like rotten threads hanging.. It those time we should be sure that the strong green candles are in position..and yes they are here..
I will update about it.
Elliott wave do exists but unlike our prediction about them.
Ray
Sunday, September 9, 2012
The Hurricane called Expanding diagonal as 5th wave!
Eur/usd has invalidated the A=C for its forth wave construction.
wave A=400 pips, Wave B=200 pips, Wave C =?
There are two possibilities C = 1.618*A OR C = 2*A.
If C = 1.618*A then Target is 1.28870 OR IF
C = 2*A then the Target is 1.3040.
_______________________________________________
This is a expanding diagonal as 5th wave and its 5th wave is throwing everything UP Side..
In this entire correction as ABC, as A and B were double zigzags.
Wave C's A is diagonal impulse, Wave B is double zigzag
and wave C's wave C is impulse with its 5th wave as diagonal and diagonal's 5th wave is the most strongest in the entire correction.
Its a Throw over, a reaction where it is more effective while its ending !
A expanding diagonal.
Wednesday, September 5, 2012
A great similarity & The departure points for dangerous fall ahead
As my A=C=400 pips counts was 1.26390, Eur/usd continued to 1.26360.
But it still lacks some 3 pips !
I should be 100 percent sure about Eur/Usd NEVER going above 1.26390 area, if it is going to be A=C !
------------------------------------------------------------
The above picture is Daily chart of eur/usd. As a major count, we are in extended 3rd wave's 4th wave.
 In above pic, where there is white arrow, there is white wave 4. This white wave 4 is very similar to current yellow 4th wave.
White wave 4 was double zigzag's construction Only.
This wave 4 contains double zigzags but not everywhere.
As a saying in elliott wave analysis literature, There are violence after every diagonal in other trend.
The case of Gbp/usd - this pair is looking forward for 3rd wave down, indicating some strong violence ahead for everything against US dollar..
But it still lacks some 3 pips !
I should be 100 percent sure about Eur/Usd NEVER going above 1.26390 area, if it is going to be A=C !
------------------------------------------------------------
The above picture is Daily chart of eur/usd. As a major count, we are in extended 3rd wave's 4th wave.

White wave 4 was double zigzag's construction Only.
This wave 4 contains double zigzags but not everywhere.
As a saying in elliott wave analysis literature, There are violence after every diagonal in other trend.
The case of Gbp/usd - this pair is looking forward for 3rd wave down, indicating some strong violence ahead for everything against US dollar..
Thursday, August 30, 2012
The flat correction as wave 4
A flat correction as wave 4 in last wave C.
Below speculated diagonal wedge as wave C of this 4th wave..
As my previous post, this wave 4 should end around 1.242,, area.

Below speculated diagonal wedge as wave C of this 4th wave..
As my previous post, this wave 4 should end around 1.242,, area.
Wednesday, August 29, 2012
ABC for wave 4
The wave counting for 4th wave (of 3rd major wave)
Its been a very complex to speculate, isn't it?
But it hasn't been that!
As I said in previous post about daily chart need a 5th wave up......
The Entire wave 4 is not WXY ( double zigzag )
Its double zigzags + double zigzags + An Impulse !

Yellow wave A = double zigzags (aqua a) + double irregulars (aqua b) + double zigzag (yellow A)
Yellow wave A = 400 pips.
Yellow wave B = double zigzag (where c = 2a)
Yello wave B = 200 pips
As rule, wave C in ABC correction should be impulse or diagonal.
Here, Yellow wave C is extended in its 3rd wave (white 3).
Is there white wave 4 ended at 1.24600..
No, it will end around 1.24200 area...! ( target for buy! )
Then a extended white wave 5 begins or a ending diagonal.
Target 1.26300 area ( where Yellow wave C = 400 pips )
Tuesday, August 28, 2012
Target for wave C Final
Below a daily chart clearly showing last wave 5 in need.

The target according to wave C=wave A is 1.263 area.

The target according to wave C=wave A is 1.263 area.
From the start of the wave 4 to speculated end 1.263 area..
Previously, I wasn't sure about eur/usd being in impulse of C wave down, it was Usd/chf lately realised me that..
If you are looking to sell euro for long, you will have to pay carry trade interest.
Advise is look for buying Usd/chf.
Friday, August 24, 2012
Target for wave C (updates)
The 4th wave's A is 400 pips.
Wave B is 200 pips
IF wave C = A then Target is 1.26391
A clear break of 1.2580 will trigger that target.
It has invalidated 0.618 relation
1.618 could be invalid according to time.
The recent decline from 1.2580 area is in ABC..expect its making a diagonal in bigger time frame.
Wave C must be an Impulse or an Ending Diagonal.
Tuesday, August 21, 2012
Elliott wave flow chart
A new dimension

Above picture White W fixes a square.
White Y contains two triangles, increasing triangle A connected decreasing triangle C
In ABC corrections, wave C should be impulse, my first impression was an Impulse...
This one started as double zigzag ( a single zig-zag in bigger time frame )
Wave A = Double zig-zag
Wave B = A Triangle
Wave C = A zigzag +?
I need target of 1.25285
Ray
First zigzag at 1.24870, correction could be deeper
Below picture, watching it carefully..

Above picture, Yellow W is first zigzag ended, we are going to see down-side correction..
WHITE Y is consisting of extended C..
This means, correction could be deeper around 1.23900 area but Surely another zigzag is in position.
Ray.

Above picture, Yellow W is first zigzag ended, we are going to see down-side correction..
WHITE Y is consisting of extended C..
This means, correction could be deeper around 1.23900 area but Surely another zigzag is in position.
Ray.
The sharp rise as wave C, a double zigzag
The descending-ascending triangle speculation is Right but in an inherent minor view.

Above picture,
Green wave A has been imposed, it has surely set target for wave C.
Wave A's is 144 pips.
Thus 1.618 times wave A equals 1.25285.
Or 2 times wave A equals 1.25810 area.
1.25285 is just below 38.2 % retracement, failure reaching this target indicates pressure for final 5th wave.
Green B is a triangle, I can see the rise after its wave e ended.
This rise indicates a zig-zag formation already opposite of supposed impulse !
It should be double zig-zag, I will portray the Last wave C of the second zigzag.
Monday, August 20, 2012
The symmetry of corrective A and B waves

Wave A (Grey circle)was supported with two zigzags and cleared major ideal target, it is also containing two irregulars which balanced the force.
Wave B(blue square) is side-ways triangle.
The while line symmetrically crosses highs and lows in above graph.
What I am looking for is wave C's formation..very very interesting.
The blue square is a side-way correction, as I wrote in previous post, last leg E could be itself a triangle, a fall around 1.230 area is enough to to prove it,
Friday, August 17, 2012
The target for wave C
Now I will see the spike for up-side in eur/usd for the next week
Wave A's 0.618 is around 1.25500 & 38.2% retracement of 3rd wave is as well at 1.25500.
And importantly the target for wave C.

What kind of wave it could be?
It shouldn't be those double zigzags since its a different phase coming.
I am most probably betting an Impulse from 1.22600 area...
Its a bet, but it could be anything..
You soared & roamed
You soared(A) & confused(B)
Now Roar(C)?
You got direction, you are starving for it. what you will do?
Ray.
(just a probability)
Charting wave E of descending(+ascending) triangle (updated)
It look like I was correct about the descending triangle forming as Major wave B.
This triangle's waves are constructed with double zig-zags, I guess wave E, the last wave of this triangle should be double zig-zag as well..

It has finished wave W as first wave for wave E.
With a ending diagonal as wave a ( interesting ) with b and c @ 61.8% ( Nice spike)
We are surely headed towards wave Y, which will full-fill the requirements for wave E
Another probability :- this white W might be wave A of another triangle in this ascending-descending triangle
making wave E as triangle it self.
Just because wave white X has retraced 61.8% percent of white wave W.
Ray
Thursday, August 16, 2012
A descending triangle as wave B?
The confusing corrections could be forming something else which I couldn't guessed !
Below picture indicates Major b wave as descending triangle.

This could be surely it, if eur/usd falls around 1.22600 area.
Above pic.
Yellow wave A= double zig-zag+double irregulars+double zig-zag
white a = double zig-zag ( end of point a marked 50% retracement of yellow A)
white b = double zig-zag
white c = double zig-zag
white d= double zig-zag ( post below)
Here, if its going to be descending triangle than white a is the lowest point in the tri angle.
white e could end around 1.22600, however a break above 1.23700 indicates fallacy of this probability.
But looking at above picture and guessing where wave B could be..it surely triangle, shallow zig-zags in a bounded channels
The start of up-side correction as zig-zags
This 4th wave has been containing zig-zag as majority.
This below picture is similar to when this 4th wave started, its double zig-zag as one making correction look like five wave impulse in bigger time frame..
5m chart showing two zig-zags below

Yellow a = expanding diagonal
Yellow b = double zig-zag
Yellow c = impulse
White X = zig-zag
Yellow a = Impulse
Yellow b = descending tri-angle,
Yellow c= double zig-zag
This overall white WXY should make just W or a.
They are surely a last phase for up-side.
I am looking for wave b to down-side around 1.230 to 1.23300 area..
It should be 50 percent retracement for wave B or wave X..
Tuesday, August 14, 2012
Eur/usd crossing 50% of retracement
Eur/usd started the 4th wave correction Up-side with these events.
Two sharp zig-zags for up. A
One semi and one sharp irregulars that retraced more than 61.8 percent of first zig-zag. B
Again two sharp zig-zag for up (ending with a expanding diagonal tri-angle, 15m chart)C (major A)
After the digonal tri-angle, the fall has marked 50 percent retracement from C, which is ideal for any wave B.
But, the double irregulars in previous phase suggests double pattern at least for wave B.
A fall between 1.22400 & 1.21300 suggests two sharp zig-zags waiting.
But a fall below 1.21300 suggest, the correction Up-side might be over.
Saturday, August 11, 2012
Eur/Usd daily chart showing hidden bearish divergence
Below chart of eur/usd daily.
This indicates the recent low in stoch should extend and go below previous LOW, it means, it should make a Lower-low. On other-side, the price should not go Beyond 1.21300, the Price should make Lower-High.
That will mean the pair is still in UP-trend
But most importantly, the High of wave C should also produce High in stoch(5.3.3)
On weekly chart, stoch should make higher-high but price should not go beyond 1.27500 area.
Making a hidden Bearish divergence. And Fix that Down-Trend.
Ray

Stoch(5.3.3) making Higher-High but Price is making Higher-lows.
This is happens in a down-trend. It is Hidden Bearish divergence.
But according to Elliot-Wave Theory. The price in above Chart has yet to make A new high and then follow the Down trend.
That means in recent periods of daily candles it should firmly make another Higher - High but stoch should Also make another Higher High..If stoch now make higher low, it will mean that Price is Still in Up-trend.
This indicates the recent low in stoch should extend and go below previous LOW, it means, it should make a Lower-low. On other-side, the price should not go Beyond 1.21300, the Price should make Lower-High.
That will mean the pair is still in UP-trend
But most importantly, the High of wave C should also produce High in stoch(5.3.3)
On weekly chart, stoch should make higher-high but price should not go beyond 1.27500 area.
Making a hidden Bearish divergence. And Fix that Down-Trend.
Ray
The Correction up-side, all most half way

Today is Saturday, 11th Aug 2012.
Eur/usd is have 4th wave correction Up-side for the 1st wave of Impulse Down-side.
It's been 19 days today and it will take long to Finish it.
Above picture showing Yellow wave A, Unfinished Yellow B.
Yellow wave A consist of white ABC, where white B is having aqua coloured abc.
They are 'double irregulars', where aqua b is wave x.
So, Yellow wave A = double zigzag (white A)+ double irregulars (white B)+double zigzag(white C).
White A is simple enough so thus white C, they are both double zigzags.
However there is no such match as A=C, 2A=C, etc.
Wave A = 1.11 times Wave in this case..
What important thing is :- ONE corrective Phase [ Yellow wave A] is over.
Next is Another Phase of Correction [ Yellow wave B] - Which is running with having finished W, it is wating for X & Y.
At that point it could have finished wave Yellow B.
There start Yellow wave C, it Should over shoot & surely making new Highs (above 1.2440 area)
Monday, August 6, 2012
How did wave A end?
A expanding diagonal triangle should be found in start of impulse or wave A.
but I think there is expanding diagonal triangle in 15m chart Eur/usd
 Then there started Correction and its still ON.
This expanding diagonal tri-angle was getting existed on early hours of Monday, when market begins trading..
but I think there is expanding diagonal triangle in 15m chart Eur/usd

This expanding diagonal tri-angle was getting existed on early hours of Monday, when market begins trading..
Sunday, July 29, 2012
5m chart showing exciting wave B
Expanding diagonal triangle & leading diagonal triangle.
Below 5m chart of eur/usd
This is the irregular wave B's b wave.

In above pic, Green A was a leading diagonal tri-angle.
The light purple wave a was a Expanding diagonal tri-angle.
This is surely Irregular ABC's B wave.
Exciting unfolding ahead.
Ray
Below 5m chart of eur/usd
This is the irregular wave B's b wave.

In above pic, Green A was a leading diagonal tri-angle.
The light purple wave a was a Expanding diagonal tri-angle.
This is surely Irregular ABC's B wave.
Exciting unfolding ahead.
Ray
Is it abc or impulse?
Eur/Usd's current correction up-side :-

This is wave 4 in 1H eur/usd chart.
Even if I look in 4h chart, I would not like to fix it with Impulse.
The daily chart of eur/usd showing great divergence ( regular one- that means trend change)!
This surely means consolidation
The title of this post, is it ABC or impulse is a question mark
It will be exciting to know about it ..
Sunday, July 22, 2012
How I am fixing this last wave, wave 5th

I find it difficult put proper wave counting for this 5th wave down that has begin, but I have tracked it down
It shouldnt move from my count !
I was bit early to end Probability 1
Below I have found some situations where Probability 1 is still alive,
But looking at the Euro sentiment, that probability 1 could be easily invalid.
The most important thing is Eur should be crossing 1.27 area.
-----------------------------------
For Probability 2, I will track waves.
Right now We are experiencing wave C's 3rd wave's 1st wave !
Lets see how wave 2 get formatted and where the 3rd of 3rd begins.
Ray
The Probability of Probability 1

The bigger Picture for Probability 1.
As we can see, the wave begin from C was a wedge impulse !
From there it has experienced double zigzag to downside.
Right now it might be finished soon and we could see the Start of brand new trend in Eur/usd
This probability is ONLY valid Eur refused to cross 1.187 Area *C wave
OR
If Eur is able to Cross 1.27600 area
Thursday, July 5, 2012
Probablity 1 Might be invalid soon!
Probability 1 :-
That Rising Wedge wasn't the Rising Wedge !
In previous post I wrote about probability 3 ! How wrong I could be, I should change the way I stick to my counting
This great fall in Eur/usd surely came from the negative news considering euro economy.
Thus, if eur/usd falls below 1.2290 surely probability 1 states invalid count.
It might be still C wave down if it doesn't cross it.
Probability 2:-
That so called rising wedge is Wave 4 from daily count, and we are in 3rd wave of 1st impulse down.
I am going to put more variations soon in this blog where I will put portions of counting in images.
Wednesday, July 4, 2012
There we go Eur/usd !!
The amazing Probability 1 :-
As the previous post states, Eur/usd was about to trigger 3rd wave up ! and I am seeing the background has been formed!
Only one rule the could be Up going rally should cross 1.27480 with Sharp green candles !
This is 3rd's wave 3rd wave beginning at this moment!
Tomorrow is big day for, as major elliott wave technicians says, 3rd wave is the wave containing great economical news, they are builders of major moves.
Predicting tomorrow's ECB meetings, Bid rate and Spanish bond auction Could be that !
So set back for tomorrow day for this probability.
Moreover, this 3rd wave could extend with its going to be extended 3rd wave !
Probability 2 :-
Eur/usd's leading wedge with truncation was wave A instead wave 1 as probability 1. it has finished wave B with double zigzag! and now finished Impulse wave C's A leg finished B leg and leading for C's C wave, this could be a Wedge as well..
This could as well cross that 1.27480 High but THEN as previous post's probability 2 sugges THE great Fall !
--------------------------------------------------------------------------
I want to add another probability
Here it is --
Probability 3 :- Tell me how it is possible that Eur/Usd is NOT Crossing 1.27480 ?
Tuesday, July 3, 2012
What could be next for eur/usd?
As previous post writings There are 2 probabilities.
Probability 1 goes on : Eur/usd on H1 chart, the major green is extended 3rd and now has finished the 4th leg down! as ABC-X-ABC OR WXY ! and Eur/usd is on LAST leg called the 5th wave and it MIGHT extend as well.
Truncation in this situation will lead to more than 68.2% decline downside !
I am guessing, as the 3rd wave has too fast too far this might be it, however, We are in 3rd wave of Major IMPULSE ( as previous post - the rising wedge is 1st wave )
The conclusion of this probability :- Eur/usd is reaching at least 1.26800 soon
The probability 2 :
As Rising wedge could be found in Wave A, we might be in leg C and this could LEAD this C leg to 1.27300 area !
And then The FALL !
That fall could make go below 1.20 that is for sure !
This is Puzzle : was that rising wedge with truncation leg A or 1st wave - This may not be puzzle any more for me if the eur/usd crosses 1.273 area SHARPLY!
End of post .
Saturday, June 30, 2012
First post : Probabilities of wave count !
Hello readers,
Starting the first post for elliott wave analysis for the pair eur/usd !
Some days ago something came in my mind before that I gotta write some thing here
I did read some elliott prediction for eur/usd using long term counting, ie weekly even monthly.
Someone was stating around jan 2012, eur/usd is having a triangle and likely going to fall for C wave down.
It didnt felt the triangle correction. However, some other elliott wave counts have been considered by me and they prove to be going right.
But some new findings are coming to my mind..
This is just Probability coming out from my observations...
Here is that Probability
I will call it Probability 1.
Here it is :- eur/usd weekly Fall from 1.60 has finished Larger ABC around 1.18 area.
From there it is going up leading Wave 1 with leading diagonal wedge pattern then after it is having abc X abc zigzag formations ending at 1.2290 area, the recent low.
Now, from here it has finished Leading diagonal wedge as wave 1@1.27500 area, 4h chart.
Then after it is having zigzag abc correction ended @ 1.24000 area.
Now Eur/usd in 3rd wave up for major Rise that could lead eur/usd to 1.60 Above levels BUT NOT ABOVE 1.80 levels, surely finishing its 5th leg( and it could be C wave?)
The pattern called Wedge, diagonal wedge, expanding-leading-declining !!
This montly wedge probabily that is experiencing wave C
This probability could be reality if eur/usd pair goes beyond 1.30 levels ...
This is the end of Probability 1!
I am going to post about Probability 2 if my Probability states incorrect.
Champions keep playing until they get it right. -Billie Jean King
Subscribe to:
Posts (Atom)